Pre-opening comments for Friday March 28th
U.S. equity index futures were lower this morning. S&P 500 futures were down 17 points at 8:30 AM EDT.
S&P 500 futures dropped 6 points following release of economic news at 8:30 AM EDT. February Core PCE Price Index was expected to increase 0.3% versus a 0.3% gain in January. Actual was a 0.4% gain. February U.S. Personal Income was expected to increase 0.4% versus 0.9% in January. Actual was a 0.8% increase. February Personal Spending was expected to increase 0.6%. Actual was a 0.4% increase
Lulu lemon dropped $19.53 to $322.00 after offering first quarter guidance below consensus.
US Steel advanced $2.27 to $45.25 on news that Nippon Steel’s offer to purchase the company could go ahead.
Braze added $3.51 to $40.21 after reporting higher than consensus fourth quarter results. The company also offered positive guidance.
Oxford Industries dropped $8.70 to $53.84 after offering guidance below consensus.
EquityClock’s Market Outlook for March 28th
The US Trade Deficit remains at an extreme as businesses seek to front-run the imposition of tariffs. See:
https://equityclock.com/2025/03/27/stock-market-outlook-for-march-28-2025/
Technical Notes for Friday
AT&T $T an S&P 100 stock moved above $27.97 to an all-time high extending an intermediate uptrend.
Broadcom $AVGO an S&P 100 stock moved below $177.07 extending an intermediate downtrend.
Dollar General $DG a NASDAQ 100 stock moved above $86.80 setting an intermediate uptrend.
Toronto Dominion Bank $TD.TO a TSX 60 stock moved above Cdn$87.57 to a 3 year high extending an intermediate uptrend.
Trader’s Corner
Equity Indices and Related ETFs
Daily Seasonal/Technical Equity Trends for March 27th 2025
Green: Increase from previous day
Red: Decrease from previous day
Source for all positive seasonality ratings: www.EquityClock.com
Commodities
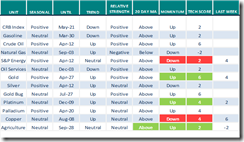
Daily Seasonal/Technical Commodities Trends for March 27th 2025
Green: Increase from previous day
Red: Decrease from previous day
Sectors
Daily Seasonal/Technical Sector Trends for March 27th 2025
Green: Increase from previous day
Red: Decrease from previous day
Links offered by valued providers
S&P 500 Rolls Over, Look Out Below! Tom Bowley
S&P 500 Rolls Over, Look Out Below! – YouTube
Morgan Stanley’s Wilson Stands by His S&P 500 Call
Morgan Stanley’s Wilson Stands by His S&P 500 Call – YouTube
Tech "Death Cross" Forming, SPX Setting Up for Pullback
Tech "Death Cross" Forming, SPX Setting Up for Pullback – YouTube
CHART THIS with David Keller, CMT Thursday 3/27/25
https://www.youtube.com/watch?v=r-Q_FVVymBQ
S&P 500 Momentum Barometers
The intermediate term Barometer dropped 2.60 to 40.80. It remains Neutral
The long term Barometer dropped 2.40 to 47.20. It remains Neutral.
TSX Momentum Barometers
The intermediate term Barometer added 0.51 to 56.42. It remains Neutral.
The long term Barometer added 1.43 to 57.34. It remains Neutral.
Disclaimer: Seasonality ratings and technical ratings offered in this report and at
www.equityclock.com are for information only. They should not be considered as advice to purchase or to sell mentioned securities. Data offered in this report is believed to be accurate, but is not guaranteed
|
|
![clip_image001[4] clip_image001[4]](https://timingthemarket.ca/techtalk/wp-content/uploads/2025/03/clip_image0014_thumb-13.png)
![clip_image002[4] clip_image002[4]](https://timingthemarket.ca/techtalk/wp-content/uploads/2025/03/clip_image0024_thumb-14.png)
![clip_image003[4] clip_image003[4]](https://timingthemarket.ca/techtalk/wp-content/uploads/2025/03/clip_image0034_thumb-11.png)
![clip_image004[4] clip_image004[4]](https://timingthemarket.ca/techtalk/wp-content/uploads/2025/03/clip_image0044_thumb-11.png)


March 28th, 2025 at 9:39 am
That’s a good interview with Mike Wilson with the link above. He is calling for a 5500 bottom but it could get worse and he sees a difficult market going six to nine months out as trade negotiations play out. Let’s say you see the usual October low and then a recovery from there as the tax cut and deregulation policies are put into place. I’m not looking for anything except a weak and volatile market until then.
March 28th, 2025 at 11:26 am
The US indexes recently retraced about 50% of their respective peak to trough, then topped, now resuming their negative trend. No surprise there, very typical technical pattern. After April 2nd, when the US economy hits a wall of import taxes and reciprocal foreign import taxes against their exports, crippling all US exports, we will see further declines as all of these new taxes start to bite. There is no positive catalyst on the horizon to reverse this trend, therefore I expect a significant decline, much like 2000 after the Tech Bubble burst. The Mag 7 were in that same overvalued territory until recently, so the indexes have a long to go before they hit bottom. Last time it took 2 years to hit bottom. Eventually there will be a buying opportunity. One can trade the swings, but too much work for me. In my RRIF and TFSA, as usual reinvesting dividends regularly like I have always done, dollar cost averaging. In my margin accounts, sitting in Money Markets ETFs or Corp Bond ETFs (for better yield) until I see a buying opportunity.
March 29th, 2025 at 4:23 pm
West Texas Intermediate Crude ($WTIC)
Crude oil seems to be ignoring the market meltdown. Crude price is maintaining the trading range it has been in for over two years. It is currently near the bottom of the trading range and may be starting to turn up.
https://schrts.co/mWBJIDnh
March 30th, 2025 at 10:26 pm
Canuck 2004,
Good to see you. Please keep posting. You can smell market bottoms like very few.