Pre-opening Comments for Tuesday April 8th
U.S. equity index futures were higher this morning. S&P 500 futures were up 136 points at 8:30 AM EDT.
Broadcom added $8.71 to $162.85 after announcing a new $10 billion share buyback program.
Levi Straus advanced $0.41 to $13.91 after reporting higher than consensus first quarter earnings and revenues.
CVS Health gained $5.46 to $69.31 after the U.S. government announced a $25 billion increase in projected payments for Medicare Advantage plans.
RPM International dropped $6.70 to $100.00 after reporting lower than consensus fiscal third quarter results.
EquityClock’s Market Outlook for April 8th
The S&P 500 Index has reached our intermediate-term downside target very quickly.
See:
https://equityclock.com/2025/04/07/stock-market-outlook-for-april-8-2025/
Technical Notes
The VIX Index opened higher yesterday, but closed at a low (dark candle) indicating a reversal pattern (i.e. possible short term peak for VIX and possible short term low for the S&P 500 Index)
Additional notable U.S. listed ETFs breaking support setting/extending intermediate downtrends included U.S. Insurance iShares. Healthcare SPDRs, Utility SPDRs, U.S. Medical Devices iShares, U.S. Real Estate iShares, Silver Miners ETF, EAFA iShares, South Korea iShares, South Africa iShares, United Kingdom iShares, Hong Kong iShares.
Another 38 S&P 100 and NASDAQ 100 stocks broke intermediate support setting/extending intermediate downtrends.
Another seven TSX 60 stocks broke intermediate support setting /extending intermediate downtrends. They were Commerce Bank, Sun Life Financial, Imperial Oil, Enbridge, Canadian National Railway, Brookfield Infrastructure and CAE.
Trader’s Corner
Equity Indices and Related ETFs
Daily Seasonal/Technical Equity Trends for April 7th 2025
Green: Increase from previous day
Red: Decrease from previous day
Source for all positive seasonality ratings: www.EquityClock.com
Commodities
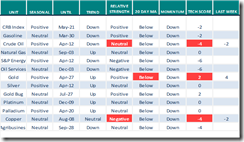
Daily Seasonal/Technical Commodities Trends for April 7th 2025
Green: Increase from previous day
Red: Decrease from previous day
Sectors
Daily Seasonal/Technical Sector Trends for April 7th 2025
Green: Increase from previous day
Red: Decrease from previous day
Links offered by valued providers
Wharton’s Jeremy Siegel: Tariffs are the biggest policy mistake in 95 years
Wharton’s Jeremy Siegel: Tariffs are the biggest policy mistake in 95 years – YouTube
Markets Will Be Up a Year From Now, Rosenberg Says
Markets Will Be Up a Year From Now, Rosenberg Says – YouTube
Market Drop Compared to 2020? What You Need to Know Now: Mary Ellen McGonagle
Market Drop Compared to 2020? What You Need to Know Now – YouTube
SPX Slips Into Bear Market, Investment Strategies & Earnings Season on Horizon: Liz An Sonders
SPX Slips Into Bear Market, Investment Strategies & Earnings Season on Horizon – YouTube
S&P 500 Momentum Barometers
The intermediate term Barometer plunged 5.20 to 7.80, lowest point since October 2022. It is extremely oversold, but has yet to show technical signs of a bottom.
The long term Barometer dropped 3.20 to 20.20, lowest level since October 2022. It remains oversold, but has yet to show technical signs of a bottom.
The short term (20 das) Barometer dropped 3.80 to 2.60, lowest level since October 2022.
TSX Momentum Barometers
The intermediate term Barometer plunged 5.50 to 17.43. It is extremely Oversold. Daily trend remains down.
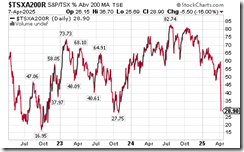
The long term Barometer dropped 5.50 to 28.90. It remains Oversold. Daily trend remains down.
Short term (20 days) Barometer dropped 6.42 to 4.59, lowest level since October 2022.
Disclaimer: Seasonality ratings and technical ratings offered in this report and at
www.equityclock.com are for information only. They should not be considered as advice to purchase or to sell mentioned securities. Data offered in this report is believed to be accurate, but is not guaranteed
|
|
![clip_image001[4] clip_image001[4]](https://timingthemarket.ca/techtalk/wp-content/uploads/2025/04/clip_image0014_thumb-1.png)
![clip_image002[4] clip_image002[4]](https://timingthemarket.ca/techtalk/wp-content/uploads/2025/04/clip_image0024_thumb-2.png)
![clip_image003[4] clip_image003[4]](https://timingthemarket.ca/techtalk/wp-content/uploads/2025/04/clip_image0034_thumb-2.png)
![clip_image004[4] clip_image004[4]](https://timingthemarket.ca/techtalk/wp-content/uploads/2025/04/clip_image0044_thumb-1.png)


April 8th, 2025 at 11:21 am
I’m quite enjoying Elon’s attacks on Navarro. “Navarro is truly a moron; dumber than a sack of bricks.” He now refers to him as “Peter Retarrdo”. It’s too funny.
I remain cautious of today’s rally but I could of course be wrong. We got oversold and hit a hard technical support point at the 200 week MA and the level of the high in 2022 of the previous bull market. My fear is that this will be a short-term relief rally and that economic problems will worsen as the US slides into recession. You have to be nimble to trade this. If earnings come down the market is still overvalued so how do you justify a significantly higher level on SPX? ll, if we are going into an economic slowdown even at the old target SPX looks overvalued. I like the comments yesterday about T-bills. You have one third of the entire US federal debt that is turning over during the next year. It’s huge but Japan actually holds more than China which has slowly been divesting itself from US t-bills.
April 8th, 2025 at 5:17 pm
Larry, this administration is a kakistocracy . Most unscrupulous, incompetent bunch of fools to ever set foot in the White House. No wonder Buffet used the terms scoundrels & fiscal folly in his 2025 report. The US is acting like an emerging market and investors will play a discount on their capital markets. A far cry from the premium they’ve enjoyed for over 30 years. Can’t short it cause the Orange Idiot could wake up one morning and change his mind. The best thing is that TSLA goes bankrupt and sends these idiots running. Thanks for your updates – greatly appreciated . Spring is coming !
April 8th, 2025 at 7:44 pm
Hi Larry
When captain cheeto took office in Jan his comments along with those early signals also had me worried about the economy so I took the opportunity to go 1/3 money market, 1/3 gold and gold miners and 1/3 private equity, structures notes and Europe. With things looking to be unsettled for a persistent timeline, private equity in Europe and maybe structured notes with the VIXX so high might be of interest. However, banks at a 6-8% dividend are hard to resist. BMO, CIBC, National and BNS all recently broke support, RY is not far behind so starting to evaluate these ones (as I suspect the CAD could appreciate against USD given the “new dynamics”. Bonds could be also good, but if you go long and are wrong it could ties the capital up for years. Any other ideas out there?
April 8th, 2025 at 10:54 pm
Thanks James and Bman/Van for posting and we had Neil/ON, Pat/Vic, Tony and Paula yesterday. We learn from each other. As the Chinese curse goes “We live in interesting times.” Bman/Van I am looking at those div yields. TD is the one that I am somehow at a lack of knowledge for. The market knows something I don’t. BMO would be my pick.
April 9th, 2025 at 12:00 am
A guest on Ambar Kanwar’s podcast stated BMO has the most exposure to the US of the CDN banks. It has been the worst-performing CDN bank over the past month.
April 9th, 2025 at 12:21 am
Looks like the next level of support for BMO is 102-104, I will keep an eye on that one. While the market is melting down quickly, it reminds me very much of the 2008 crisis, so my earlier comments about bank dividend rates is probably to the conservative side 8-10% yield may be the compelling range to start to buy.